


Tomography 2024, 10(4), 618-631; https://doi.org/10.3390/tomography10040047 - 19 Apr 2024
Abstract
Background: Surgeons have limited knowledge of the lumbar intervertebral foramina. This study aimed to classify osteophytes in the lumbar intervertebral foramen and to determine their pathoanatomical characteristics, discuss their potential biomechanical effects, and contribute to developing surgical methods. Methods: We conducted a retrospective,
[...] Read more.
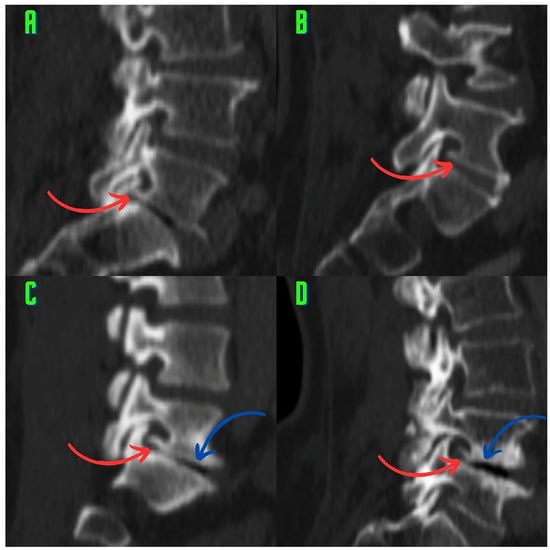
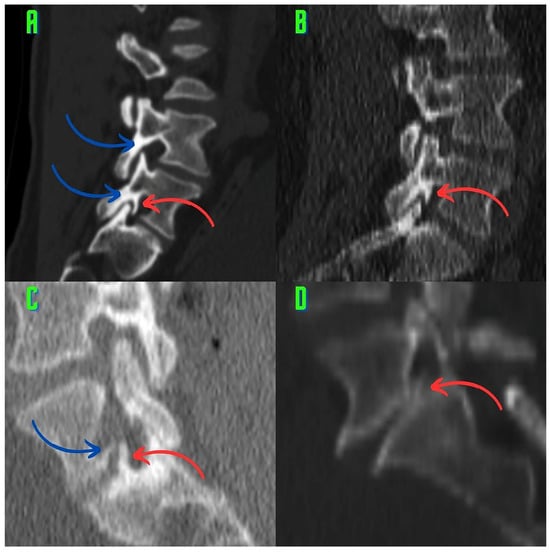
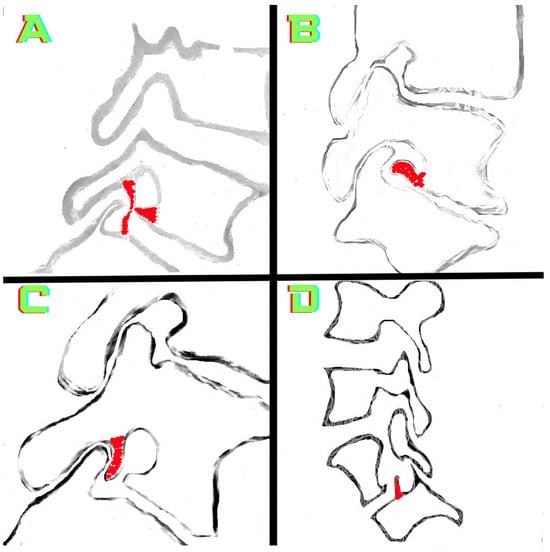
Background: Surgeons have limited knowledge of the lumbar intervertebral foramina. This study aimed to classify osteophytes in the lumbar intervertebral foramen and to determine their pathoanatomical characteristics, discuss their potential biomechanical effects, and contribute to developing surgical methods. Methods: We conducted a retrospective, non-randomized, single-center study involving 1224 patients. The gender, age, and anatomical location of the osteophytes in the lumbar intervertebral foramina of the patients were recorded. Results: Two hundred and forty-nine (20.34%) patients had one or more osteophytes in their lumbar 4 and 5 foramina. Of the 4896 foramina, 337 (6.88%) contained different types of osteophytes. Moreover, four anatomical types of osteophytes were found: mixed osteophytes in 181 (3.69%) foramina, osteophytes from the lower endplate of the superior vertebrae in 91 (1.85%) foramina, osteophytes from the junction of the pedicle and lamina of the upper vertebrae in 39 foramina (0.79%), and osteophytes from the upper endplate of the lower vertebrae in 26 (0.53%) foramina. The L4 foramen contained a significantly higher number of osteophytes than the L5 foramen. Osteophyte development increased significantly with age, with no difference between males and females. Conclusions: The findings show that osteophytic extrusions, which alter the natural anatomical structure of the lumbar intervertebral foramina, are common and can narrow the foramen.
Full article
(This article belongs to the Topic AI in Medical Imaging and Image Processing)
►
Show Figures
Figure 1

